
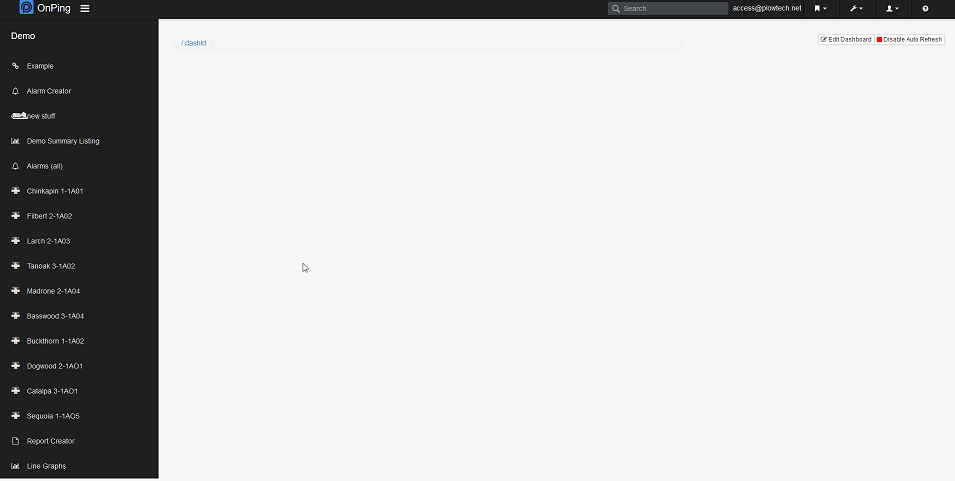
Dashboards provide a basic framework that gives users the ability to customize screens for specific data. For most users, the first screen that appears when logging into Onping is their main dashboard. In the photo below, you will notice a white blank section of the screen and panels on the left side. Panels are beneficial for monitoring field production, such as alarms, report creator, and links to individual location dashboards are commonly found on the main dashboard. The icons next to the panel name is customizable to help the user easily recognize the functionality of that panel.
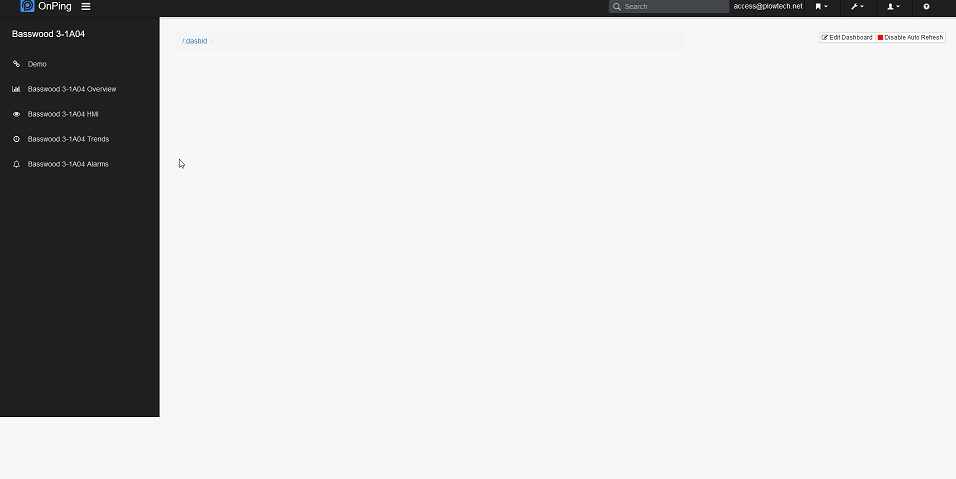
Individual location dashboards normally follow a standard layout, but can always be customized to user preferences for viewing data. Usually there will be a link back to the main dashboard, an overview, HMI, trends, and alarms. To view the location data, click on the desired panel.
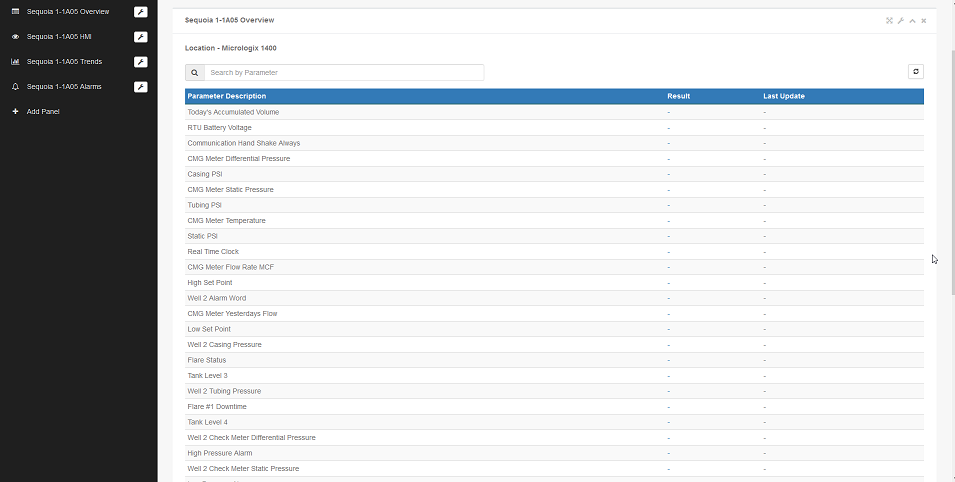
The overview panel normally displays a multi-parameter table widget, listing all relevant data points with the result and last update information. The refresher icon at the top right above the table can force the data to poll if needed for a more updated result.
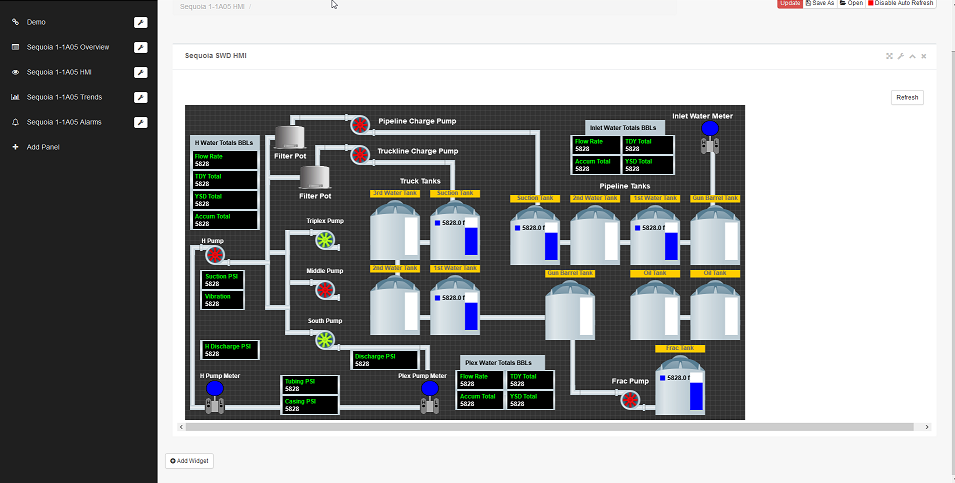
The HMI panel displays the human interface widget that is customizable to how the user prefers to view the data. The HMI below is mapped out to reflect the layout of the location, showing tank levels, various pressures, flow rates, running pumps, etc.
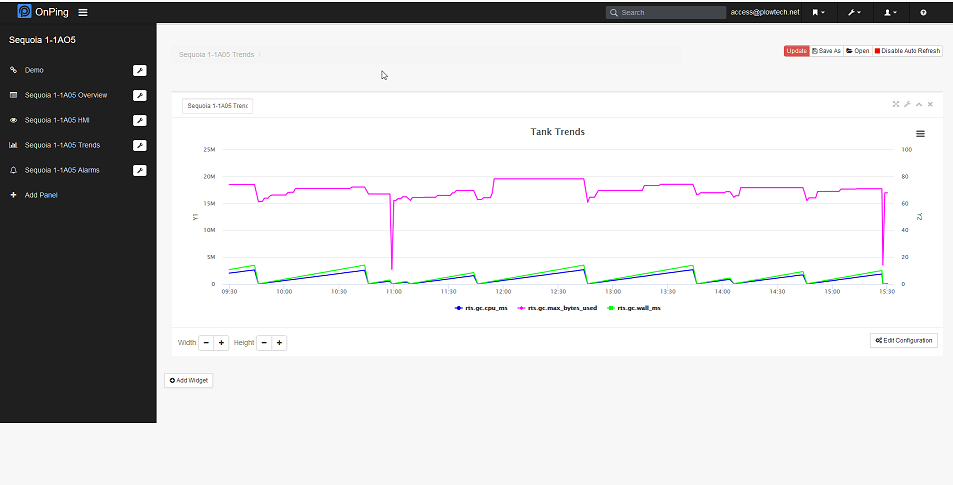
The trends panel displays the line graph widget used for viewing parameter changes. Any combination of parameters can be put on one or multiple graphs for comparisons. Graphs can be viewed at any desired time period (24 hour, 3 day, 1 week, etc.) and can also show data in various increments (1 minute, 5 minutes, 1 hour, or auto). Color preferences are also available.
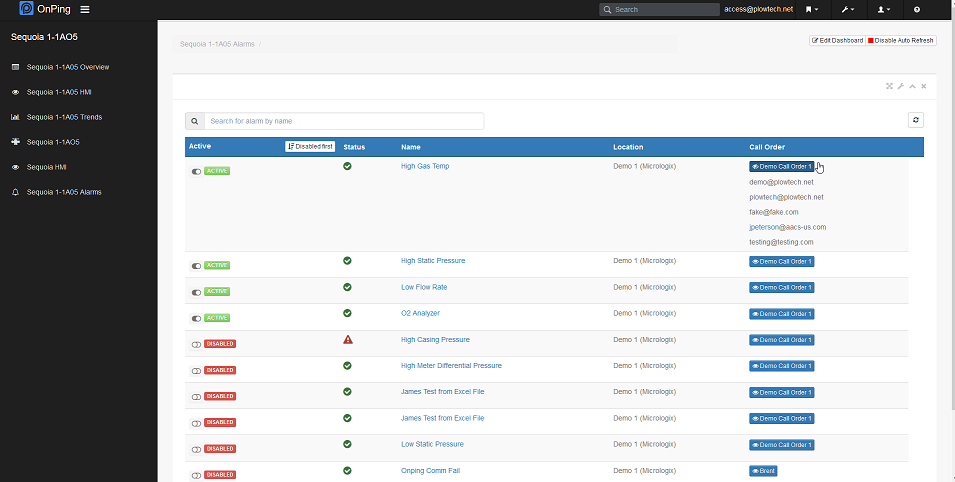
The alarms panel shows all alarms associated with the specific location, the call order it is assigned to, and whether the alarm is turned on or off. Clicking on the call order will show all users assigned to that alarm. Users can also turn alarms on and off by selecting "active" or "disable."
Dashboards are not only limited to the panels previously discussed. Set point panels can be created using custom table widgets to allow users to change tank levels, pressure levels, etc. remotely. Click on this link to learn more about different types of dashboard widgets.
https://onping.zendesk.com/hc/en-us/articles/360000369592-Adding-a-Widget-and-Content-to-a-panel
If you have any thoughts, ideas, or questions, please feel free to leave a comment below or use the contact feature at www.onping.net
Comments
0 comments
Please sign in to leave a comment.